设置输入参数
t = [0:0.01:0.98]
设置函数sin
y1 = sin(2*pi*4*t)
绘制
plot(t,y1)
在旧的图像上绘制新的图像
hold on
完整例子
>> t = [0:0.01:0.98]
>> y1 = sin(2*pi*4*t)
>> y2 = cos(2*pi*4*t)
>> plot(t,y1)
>> plot(t,y2)
>> hold on;
>> plot(t,y2,'r')//r表示red
>> plot(t,y1,'b') //b表示blue
>> xlabel('time') //设置x轴标签
>> ylabel('value') //设置y轴标签
>> legend('sin','cos') //设置曲线含义
>> title('my plot') //设置图像标题
>> cd 'F:\' ; print -dpng 'myPlot.png' //进入F盘并且保存图片
>> close//关闭
输出两个图像
>> figure(1);plot(t,y1);
>> figure(2);plot(t,y2);
>>
image20210606231436el8a569.png
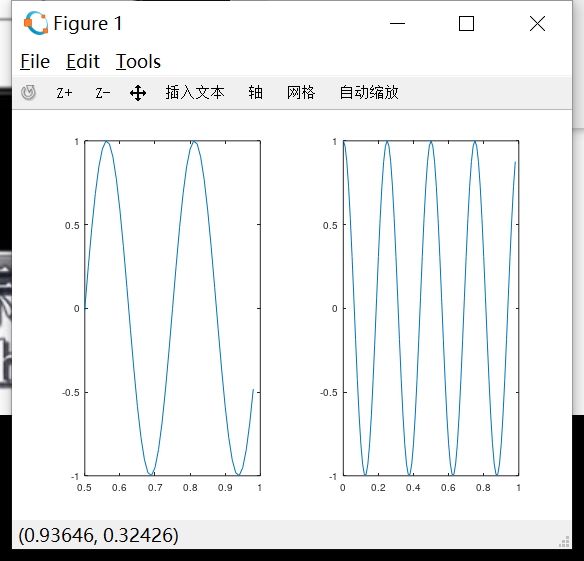
subplot将图像分为一个1*2的格子
ༀ>> subplot(1,2,1);
>> plot(t,y1)
>> subplot(1,2,2);
>> plot(t,y2);
>>
image2021060623181477nb7do.png
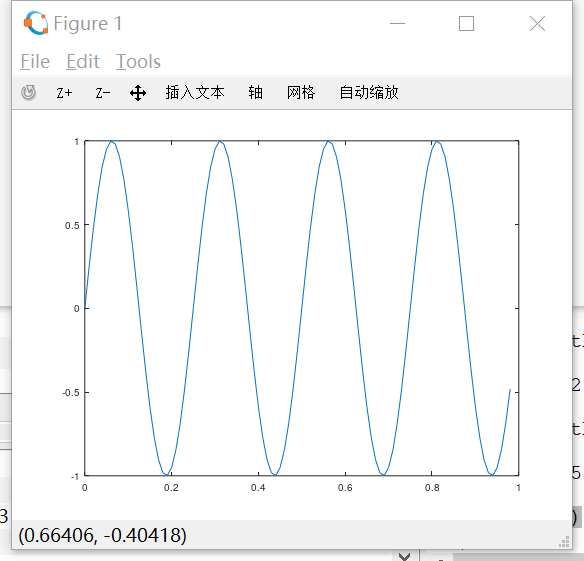
改变图的刻度
>> axis([0.5 1 -1 1])
清除图像
clf
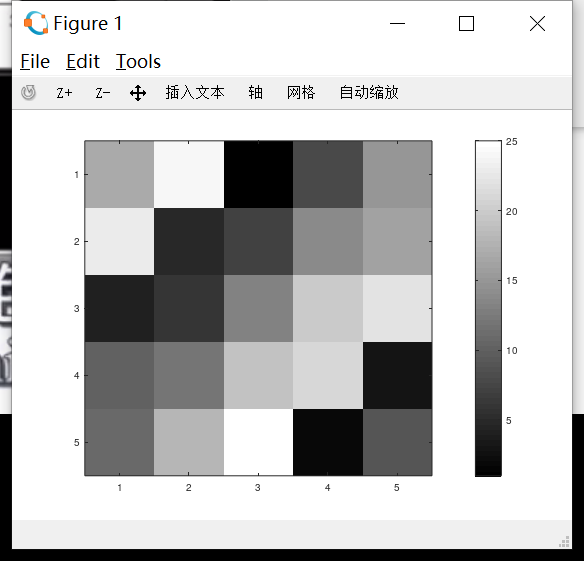
生成灰度图像
>> imagesc(magic(5)),colorbar,colormap gray;
>>